
How Solar Panels Work in Different States In The US
- ifeoluwa Daniel
- Nov 6, 2025
- 9 min read

A homeowner in cloudy Pennsylvania might actually save more money with solar panels than someone living in sunny Arizona. And someone in Washington DC, despite higher installation costs and less sunshine than Nevada, could see their investment pay back in half the time.
Solar panels generate electricity the same way regardless of where you install them. But how solar "works" for your wallet? That's a completely different story depending on your state. The combination of sunlight hours, electricity rates, state incentives, and net metering policies creates dramatically different outcomes from one state to another.
This guide breaks down exactly how solar performs in different parts of the country and why some states deliver better returns than others despite less sunshine.
Key Takeaways
Solar panels function identically everywhere, but financial performance varies dramatically by state due to electricity rates, incentives, and policies.
Cloudy states like Pennsylvania and Maryland can outperform sunny states financially due to high electricity rates and strong SREC programs.
Net metering policies are the hidden factor that determines long-term solar savings—full retail credit vs. reduced export rates changes everything.
Installation costs vary by 40%+ between states ($2.07/W in Arizona vs. $3.02/W in DC), but higher costs don't always mean worse returns.
State incentives and utility rebates can add $5,000-$15,000+ in value beyond the federal 30% tax credit.
Do Solar Panels Actually Work Differently by State?
Let's clear this up immediately: solar panels themselves don't work differently depending on location. A 400-watt solar panel in California produces the same voltage and current as an identical panel in Pennsylvania when exposed to the same sunlight intensity.
What changes dramatically is how much electricity your panels generate and how much that electricity is worth. These two factors create wildly different financial outcomes depending on where you live.
Sunlight Hours

Peak sun hours—the equivalent hours of full-intensity sunlight (1,000 watts per square meter)—determine how much electricity your solar panels produce annually.
Sunlight Category | State | Peak Sun Hours Daily | Annual Production (5kW System) |
High-Sun States | Arizona | 6+ hours | 7,800-8,500 kWh |
Nevada | 5.5-6 hours | 7,500-8,000 kWh | |
Texas | 5-6 hours | 7,200-7,800 kWh | |
Florida | 5-5.5 hours | 7,000-7,500 kWh | |
California | 5-6 hours | 7,200-7,800 kWh | |
Moderate-Sun States | Colorado | 4.5-5 hours | 6,500-7,200 kWh |
South Carolina | 4.5-5 hours | 6,500-7,200 kWh | |
Georgia | 4.5-5 hours | 6,500-7,200 kWh | |
Oklahoma | 4.5-5 hours | 6,500-7,200 kWh | |
Maryland | 4-4.5 hours | 6,000-6,500 kWh | |
Lower-Sun States | Pennsylvania | 3.5-4.5 hours | 5,800-6,500 kWh |
Washington DC | 4-4.5 hours | 6,000-6,500 kWh |
A 5 kW system in Arizona produces roughly 7,500-8,000 kWh annually, while the same system in Pennsylvania generates 6,000-6,500 kWh, about 20-25% less electricity. That's a meaningful difference in production.
But here's where it gets interesting: that Pennsylvania system might still deliver better financial returns than the Arizona one.
Why High-Sun States Don't Always Win
Solar panels work best where you'd expect—sunny states with clear skies. But solar savings work best where electricity is expensive and policies are favorable.
The Electricity Rate Factor
What you pay per kilowatt-hour determines the value of every kilowatt-hour your solar panels generate. High electricity rates can completely offset lower solar production.
Rate Category | State | Average Electricity Rate | Value per kWh Generated |
High-Rate States | California | 30-40¢/kWh (TOU) | 30-40¢ |
Washington DC | 13-15¢/kWh | 13-15¢ | |
Moderate-Rate States | Pennsylvania | 13-15¢/kWh | 13-15¢ |
Maryland | 13-15¢/kWh | 13-15¢ | |
Florida | 12-14¢/kWh | 12-14¢ | |
Colorado | 12-14¢/kWh | 12-14¢ | |
Lower-Rate States | Texas | 11-13¢/kWh | 11-13¢ |
Arizona | 12-13¢/kWh | 12-13¢ | |
Nevada | 11-12¢/kWh | 11-12¢ | |
Georgia | 11-13¢/kWh | 11-13¢ | |
Oklahoma | 10-12¢/kWh | 10-12¢ | |
South Carolina | 12-13¢/kWh | 12-13¢ |
Let's run the math on two states:
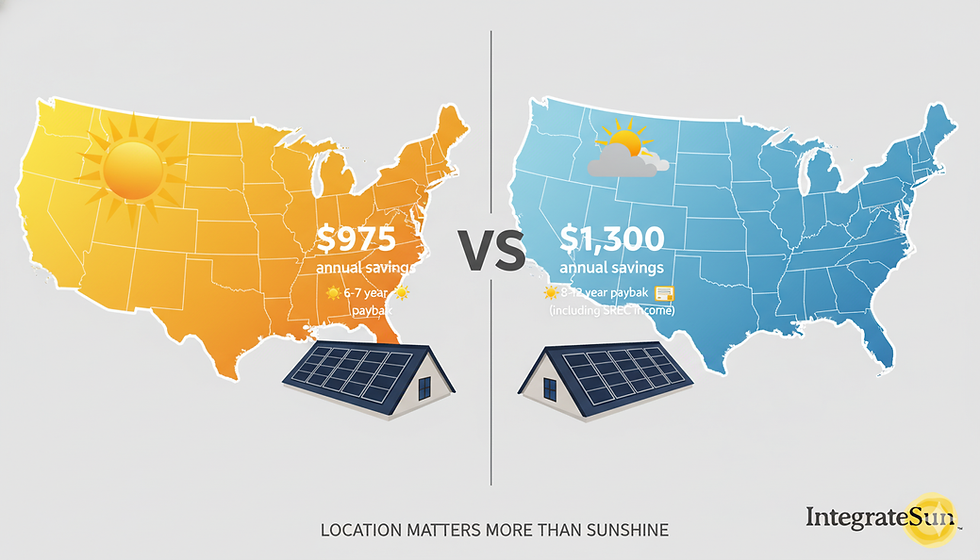
Arizona (sunny, lower rates):
5 kW system produces 7,800 kWh annually
Electricity rate: 12.5 cents/kWh
Annual savings: 7,800 × $0.125 = $975
Pennsylvania (less sunny, higher rates):
5 kW system produces 6,500 kWh annually
Electricity rate: 14 cents/kWh
Annual savings: 6,500 × $0.14 = $910
Pennsylvania's 20% lower production is nearly offset by higher electricity rates. But we're not done yet. State incentives change everything.
State Incentives: The Game-Changers
The federal 30% Investment Tax Credit applies everywhere. But state-level programs create massive value differences between locations.
Solar Renewable Energy Certificates (SRECs)

Some states have SREC markets where you earn tradable certificates for every megawatt-hour (1,000 kWh) of solar production. These certificates generate ongoing income for 10-15+ years beyond your electricity savings.
Washington DC (highest SREC values nationally):
SREC value: $400-$455 each
5 kW system produces ~6.5 MWh annually = 6.5 SRECs
Annual SREC income: $2,600-$2,958
Combined with electricity savings: $3,500-$4,000 total annual value
Pennsylvania:
SREC value: ~$31.25 each
5 kW system produces ~6.5 MWh annually = 6.5 SRECs
Annual SREC income: ~$203
Combined with electricity savings: $1,100-$1,300 total annual value
Maryland:
SREC value: ~$59 each (certified SRECs worth 1.5x standard)
5 kW system produces ~6.5 MWh annually = 6.5 SRECs
Annual SREC income: ~$384
Combined with electricity savings: $1,300-$1,500 total annual value
This is why Washington DC, despite higher installation costs and less sunshine than Arizona, achieves 3.7-6 year payback periods (averaging 4.6 years) compared to Arizona's 6-7 years. Those SRECs add thousands in annual income that Arizona homeowners simply don't receive.
Utility Rebates
Some states offer substantial upfront rebates that directly reduce your installation cost:
Texas:
Oncor: Up to $9,000 for qualifying systems
CenterPoint: Up to $3,000
AEP Texas SmartSource: $3,000
South Carolina:
Santee Cooper: $950 per kW (up to $5,700 for larger systems)
Colorado:
Xcel Energy Solar*Rewards: $1 per watt (up to $7,000) for income-qualified areas
Arizona:
Mohave Electric Cooperative: $0.05 per watt (up to $2,500)
These rebates stack with the federal 30% tax credit, creating significantly lower net costs. A Texas homeowner with Oncor service could reduce a $14,000 system cost to just $1,800 after the federal credit and Oncor rebate, changing the entire value proposition.
Battery Storage Incentives
California:
SGIP (Self-Generation Incentive Program): $150-$1,000 per kWh, depending on eligibility tier
For a 13.5 kWh battery: $2,025-$13,500 in rebates
Maryland:
Residential & Commercial Energy Storage Grant: Variable amounts replacing expired storage tax credit
Battery incentives are critical in states with Time-of-Use rates or frequent outages, making storage economically viable where it otherwise wouldn't be.
Net Metering: The Hidden Factor That Changes Everything

Net metering determines what happens to excess solar electricity you don't immediately use. This policy varies dramatically by state and has massive long-term financial implications.
Full Retail-Rate Net Metering (Best Case)
Pennsylvania, Maryland, Florida, Colorado:
Excess solar exported to the grid = full retail-rate credit
If you pay 14 cents/kWh, you receive 14 cents/kWh credit for exports
Credits typically roll month-to-month, with annual true-ups
Example: Your Pennsylvania system produces 800 kWh but you only use 500 kWh. The extra 300 kWh earns 300 × $0.14 = $42 in credits applied to future bills. When your usage exceeds production (winter months), those credits offset your grid consumption.
Reduced Export Rates (Moderate Case)
California (NEM 3.0):
Export credits: 5-30 cents/kWh depending on time of day
Retail rates: 30-40 cents/kWh during peak evening hours
Strategy: Store daytime solar in batteries, use during expensive evening hours
Nevada (NV Energy NEM):
Export credits: ~75% of retail rate
Time-of-Use based, typically 9-11 cents/kWh export vs. 11-12 cents/kWh retail
Reduced export rates still provide value, but they favor self-consumption and battery storage over exporting excess production.
Avoided-Cost or Limited Net Metering (Challenging Case)
Georgia:
Georgia Power offers "Monthly Netting" but program capacity is limited
Export credit: ~6.68 cents/kWh (avoided cost)
Retail rate: 11-13 cents/kWh
Waitlists exist for new participants
Oklahoma:
Net metering at avoided cost for excess (varies by utility)
OG&E and PSO offer interconnection but limited export value
In these states, solar still makes sense, but payback periods stretch to 10-14 years instead of 6-8 years. The emphasis shifts to sizing systems to match consumption rather than overproducing.
Why Installation Costs Vary 40%+ Between States
Solar panel prices aren't uniform nationally. Installation costs vary significantly based on local labor rates, competition, permitting complexity, and market maturity.
Solar Installation Costs by State
Cost Tier | State | Cost per Watt | 5kW System Cost (Before ITC) |
Lowest Cost | Arizona | $2.07-$2.77/W | $10,350-$13,850 |
Texas | $2.14-$2.84/W | $10,700-$14,200 | |
Florida | $2.18-$2.71/W | $10,900-$13,550 | |
Nevada | $2.25-$2.85/W | $11,250-$14,250 | |
Moderate Cost | California | $2.34-$3.14/W | $11,700-$15,700 |
Oklahoma | $2.34-$2.62/W | $11,700-$13,100 | |
Georgia | $2.42-$3.06/W | $12,100-$15,300 | |
South Carolina | $2.53-$3.10/W | $12,650-$15,500 | |
Higher Cost | Pennsylvania | $2.64-$3.16/W | $13,200-$15,800 |
Maryland | $2.66-$3.01/W | $13,300-$15,050 | |
Colorado | $2.86-$3.80/W | $14,300-$19,000 | |
Washington DC | $3.02-$3.34/W | $15,100-$16,700 |
For a 5 kW system, that's the difference between $10,350 (Arizona) and $16,700 (DC), a $6,350 spread before incentives.
Higher costs don't mean worse returns. Washington DC's higher installation cost is more than offset by massive SREC income and faster payback despite the premium pricing.
Does Solar Work in Cloudy States?
Absolutely. Germany has more solar capacity than Texas despite weather comparable to Alaska. Pennsylvania, Maryland, and Washington DC all deliver strong solar returns despite moderate sunlight.
The key factors that make solar work in cloudier states:
1. Higher Electricity Rates: When you're paying 14-15 cents/kWh instead of 11 cents/kWh, each kilowatt-hour produced has more value.
2. Strong SREC Markets: Pennsylvania and Maryland homeowners earn hundreds to thousands annually from SREC sales, completely offsetting lower production.
3. Full Retail Net Metering: Getting full credit for exported electricity maximizes the value of every kilowatt-hour produced.
4. Snow Benefits: Snow reflects sunlight, boosting panel efficiency on sunny winter days. Panels also shed snow quickly due to their angle and smooth surface.
Solar panels need light, not heat. In fact, panels work more efficiently in cooler temperatures—a 70°F sunny day in Pennsylvania generates more power per panel than a 110°F day in Arizona, despite Arizona's stronger sunlight intensity.
Choosing the Right System for Your State
Understanding how solar works in your specific state means optimizing your system design for local conditions:
In High-SREC States (DC, PA, MD):
Maximize system size to generate more certificates
SRECs provide ongoing income regardless of self-consumption
Larger systems pay for themselves faster due to SREC revenue
In High-Rate, Reduced-Export States (California):
Pair solar with battery storage
Size systems for self-consumption during expensive peak hours
Minimize grid exports since export credits are low compared to retail rates
In Strong Net Metering States (PA, MD, FL, CO):
Optimize system size for annual energy offset
Oversizing slightly is acceptable since full retail credits apply
Focus on maximizing annual production
In Limited Net Metering States (GA, OK):
Size conservatively to match consumption
Avoid significant overproduction since export value is minimal
Consider battery storage for excess production utilization
In High-Rebate States (TX, SC, CO):
Act quickly on utility rebates—many have limited funding
Larger systems maximize rebate value
Combine with federal credit for lowest net cost
Get Expert Guidance for Your State
IntegrateSun operates across 12 states with local teams who understand regional solar markets, incentive programs, and utility requirements. Whether you're in sunny Arizona or cloudy Pennsylvania, high-cost Colorado or low-cost Texas, we'll design a system optimized for your state's specific conditions.
We'll analyze:
Your actual electricity usage and rate structure
Available federal, state, and utility incentives
Optimal system size for your state's net metering rules
Equipment recommendations based on local climate
Realistic production and savings projections
Schedule a Free Consultation to discuss how solar performs in your specific state, or Get a Free Quote for detailed cost and savings projections based on your location and usage.
Solar works differently everywhere. Let's make sure it works best for you.
FAQs
Do solar panels work in states with less sunshine?
Yes, solar panels work effectively in states with moderate sunlight like Pennsylvania, Maryland, and Washington DC. While these states produce 20-30% less electricity per panel than Arizona or Nevada, they often deliver comparable or better financial returns due to higher electricity rates, SREC income, and favorable net metering policies. Germany—with weather comparable to Alaska—has massive solar capacity, proving sunshine isn't the only factor that matters. Solar panels need light, not heat, and actually operate more efficiently in cooler temperatures common in northern states.
Why does Washington DC have faster payback than Arizona despite less sunshine?
Washington DC's SREC (Solar Renewable Energy Certificate) program is the strongest in the nation, with SRECs worth $400-$455 each. A typical 5 kW system generates 6.5 SRECs annually, providing $2,600-$2,958 in annual income beyond electricity savings. This SREC income dramatically accelerates payback to 3.7-6 years (averaging 4.6 years) despite DC's higher installation costs and moderate sunshine. Arizona lacks SREC programs and has lower electricity rates, resulting in 6-7 year payback periods despite abundant sunshine and lower installation costs.
How does net metering affect solar performance state-by-state?
Net metering policies determine the value of excess solar electricity you export to the grid, significantly impacting long-term savings. Full retail-rate net metering (Pennsylvania, Maryland, Florida, Colorado) credits exported electricity at the same rate you pay, maximizing value. Reduced export rates (California's NEM 3.0 at 75-80% of retail, Nevada at 75%) still provide value but favor battery storage and self-consumption. Limited or avoided-cost net metering (Georgia at 6.68¢/kWh, Oklahoma varies by utility) extends payback periods to 10-14 years since exports earn minimal value. Always verify your state's net metering rules before sizing your system.
Which states offer the best solar incentives beyond the federal tax credit?
Top incentive states include: Washington DC (SRECs worth $400-$455 each generating $2,600+ annually), Texas (Oncor rebates up to $9,000, CenterPoint $3,000, AEP Texas $3,000), California (SGIP battery rebates $150-$1,000/kWh), South Carolina (Santee Cooper $950/kW up to $5,700), Colorado (Xcel Solar*Rewards $1/watt up to $7,000), Maryland (certified SRECs ~$59 each, energy storage grants), Pennsylvania (SRECs ~$31.25 each), and Arizona (25% state tax credit up to $1,000). These incentives stack with the federal 30% tax credit, substantially reducing net costs and accelerating payback periods.
Does solar make sense in states with low electricity rates?
Yes, but payback periods are longer. States like Oklahoma, Georgia, and parts of Texas have electricity rates of 10-13 cents/kWh compared to 14-15 cents/kWh in higher-rate states. Lower rates mean each kilowatt-hour of solar production provides less savings. However, solar still makes financial sense—especially in low-rate states with strong incentives. Texas combines low rates with substantial utility rebates (up to $9,000), no state income tax, and property tax exemptions, achieving 6-8 year paybacks. Even Oklahoma and Georgia, despite 11-14 year paybacks, provide positive returns over 25+ year system lifespans while offering energy independence and protection against future rate increases.


